Temperatur
Zahlen
Temperatur global
Quelle
global
Year
atmos. conc.(ppm)
increment/a(ppm)
emission total/a(Gt CO2)
emiss.anthrop/a(Gt CO2)
portion anthrop.(%)
temp. (°C)
increment/a (°C)
1900-1940
300 - 307
0,175
1,4
0,08 (!)
6
13,9 - 14,5
0,015
1940-1975
307 - 331
0,69
5,5
0,34
6,2
14,5 - 14,45
0
1975-1998
325 - 365
1,74
14
0,30
2,2
14,45 - 14,7
0,01
2018
407-410
+3
24
0,36
1,5
14,1
0,3
2019
410-412
+2,5
20
1,8
14,4
2020
412-415
1,7
14,6
0,2
2021
415-’418’
0,35
14,9
0.3
2022
421
15,1
measured
Ozeane
calculated
reported
estimated
Regen, Schnee, Eis
Regenmenge DE (1a --> letzten kompl. Monat)
Quellehttp://temperature.global/?fbclid=IwAR2vF552qjvq5vU4DRewj3oTa7 LbTYZGq_wzOwZIvm_4lmhTbYFHmnwRzt8
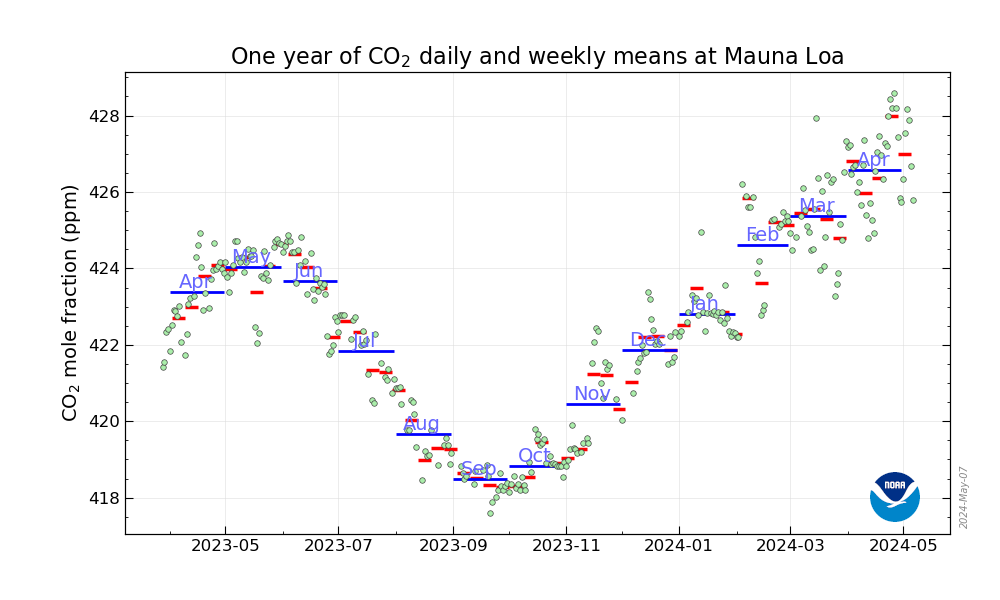
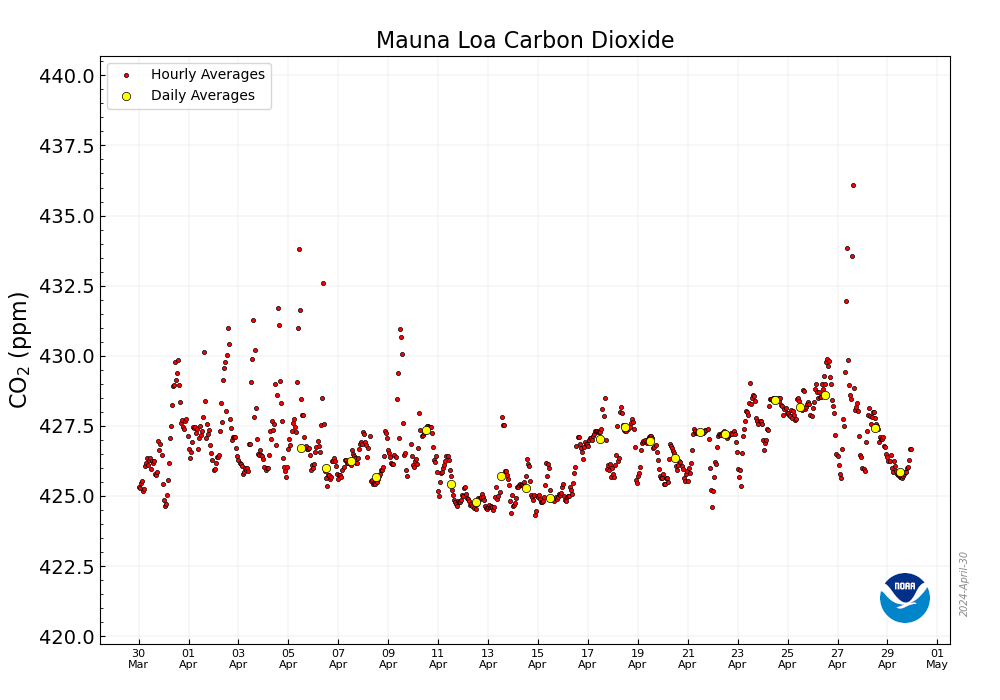
Mount Maona, Hawaii
CO2-Emissionenhttps://www.climate4you.comhttps://www.drroyspencer.com
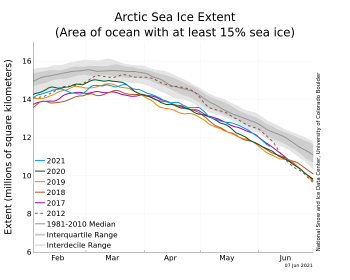
. Arctic Quelle: NASA, update first week of months
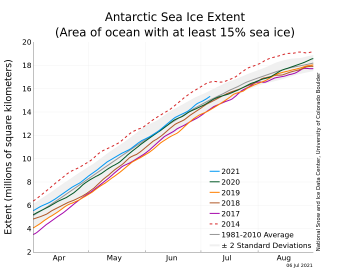
.Antarctic Quelle: NASA, update first week of monthsNASA-Eismengenvideo
Januar 13, 2023
CO2-Messwerte stationär